Recently I was looking at a Triton Server tutorial which used the tf2onnx utility for converting a tensorflow model to onnx format. Triton is a tool which serves ML models, such as those from the tensorflow framework. Triton has a tensorflow backend, but it doesn’t support models from tenorflow v1 like the EAST text detection model used in the tutorial, so it’s necessary to convert the model to onnx format to serve it with Triton.
This got me wondering how does this work converting a model from one format to another, and especially, what are these inputs and outputs that you need to specify for the conversion utility? Links to the tutorial and the original paper are at the bottom of the page if you’re interested in exploring more.
tf2onnx Example
This is the command used in the tutorial to convert the tensorflow model to onnx.
python -m tf2onnx.convert --input frozen_east_text_detection.pb --inputs "input_images:0" --outputs "feature_fusion/Conv_7/Sigmoid:0","feature_fusion/concat_3:0" --output detection.onnx
Firstly, let’s clear up what’s otherwise going on in the above command. The tf2onnx.convert utility is being called, and the tenorflow model being converted is the pre-trained model stored in the frozen_east_text_detection.pb file. That’s a protobuf file which stores the model graph and weights. The onnx format model is going to be stored at the detection.onnx file location.
I looked into the code and realised that these are nodes in the tensorflow model graph, so, for example input_images:0 relates to the first (0 index) node in the graph labelled as input_images. Selecting inputs and outputs allows us to choose which parts of the model graph we would like to be converted to an onnx format.
How can we see the model graph such that we could make such a choice? Tensorflow include a helpful model summary method which can be visualised in Tensorboard. Let’s download the tensorflow model from dropbox here and unpack it.
tar -xvf frozen_east_text_detection.tar.gz
Visualising the TF Model
We can use this python code to use the tf.summary.graph method which writes a summary of the graph using a tf.summary.writer, which in this case writes to the ./logs directory. You’ll need a python runtime with tensorflow installed for this to work.
Let’s create the logs directory, run the code and then visualise with tensorboard.
mkdir logs
python write_tf_graph.py frozen_east_text_detection.pb
tensorboard --logdir logs
This should start tensorboard as a local webserver running on http://localhost:6006/. If you navigate to that address in your web browser you should be able to see the frozen east text detection model visualised as a graph in tensorboard.
In the tensorboard UI, it’s easy to navigate the graph and search for the nodes, for example you can search for the node named feature_fusion/Conv_7/Sigmoid and tensorboard will highlight this for you.
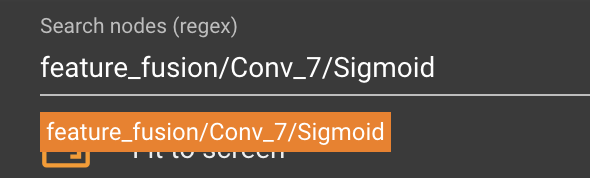
Search TF Graph in Tensorboard
You can quickly see that the model is composed of a feature extraction component (in this case resnet50) and a feature fusion component. From looking at the original paper and the tensorflow graph we can see that this node is in the output layer and produces the scores. It’s more difficult to see what the feature_fusion/concat_3 node is doing, but it seems to produce the geometry outputs according the triton tutorial and we can see from the graph that this is an output node.
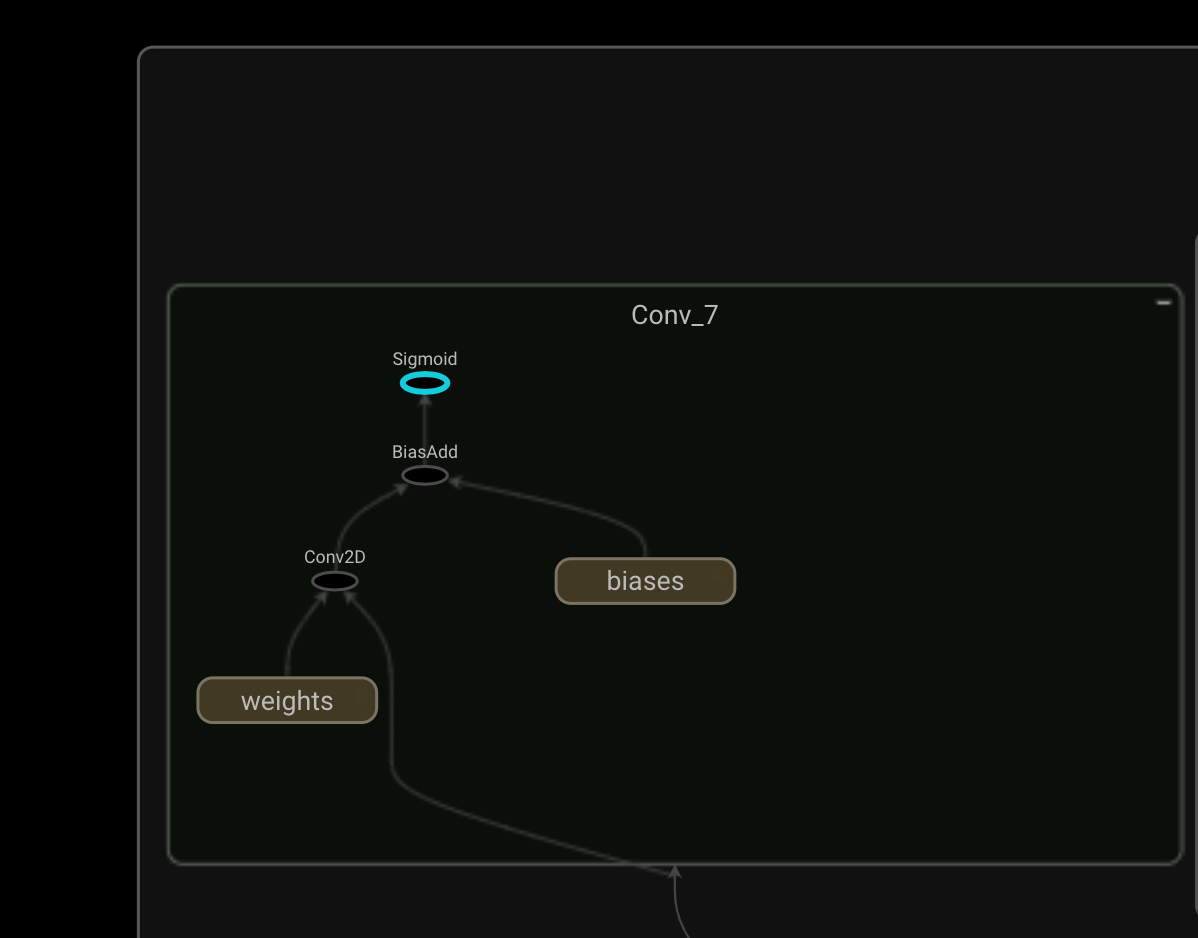
Output component
Links
- Here’s the triton tutorial that sparked my interest
- If you’re interested in a deep dive into the text detection model, here’s the EAST text detection original paper.